Data mining of large size datasets with geospatial information
Learning from Geospatial Data and Images
This project topic addresses the science question:
How is the global Earth system changing?
and
What factors influence/modulate the changes in global ecosystem?
The specific science questions that this project is focused on are:
- How are evolving surface variables such as vegetation indices, temperature, and emissivity, as obtained from the NASA TERRA and AQUA platforms, dynamically linked?
- How do they evolve in response to climate variability such as ENSO (El Niño Southern Oscillation)?
- How are they dependent on temporally invariant factors such as topography (and derived variables such as slope, aspect, nearness to streams), soil characteristics, land cover classification, etc?
Answers to these questions, at the continental to global scales will enable us to develop better parameterization of the relevant processes in forecast models for weather, and inter-seasonal to inter-annual climate prediction. However, answering these questions requires the ability to perform analysis of a multitude of variables using very large datasets. The project addresses the following computer science questions:
The research and development led to a software prototype called Geospatial Image To Learn (GeoLearn) and in the case of Discharge/Recharge Modeling to a Spatial Pattern to Learn (Sp2Learn) software.
GeoLearn was created as a joint collaboration between the
Civil and Environmental Engineering Department
(CEE) and the National Center for Supercomputing Applications (NCSA) at UIUC.
Funding support was provided by National Aeronautics and Space Administration
(NASA), National Archive and Record Administration (NARA), and National Science
Foundation (NSF).
Sp2Learn was created as a joint joint research of NCSA and
Illinois State Water Survey (ISWS).

Learning from Geospatial Data and Images, GeoLearn
GeoLearn has been prototyped as a novel simulation and exploratory environment for prediction modeling from remote sensing imagery, and large size geospatial raster and vector data. The GeoLearn framework has the functionality to read data sets from local and remote sites; extract features like slope from elevation; mosaic tiles; perform quality assurance of remotely sensed images; integrate images; spatially select pixels by masking with boundaries, geo-points, maps with categorical variables, thresholded maps with continuous variables or painted regions using primitives; extract pixels over a mask, perform data-driven modeling using machine learning techniques, provide interpretation of models in terms of variable relevance and visualize a variety of input, output and intermediate data.
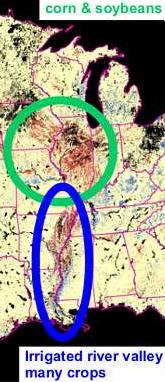
We illustrate the application of the framework to exploring vegetation greenness as a function of climate, terrain, water and soil. The regions with large deviations from predicted values are shown in the image (left).

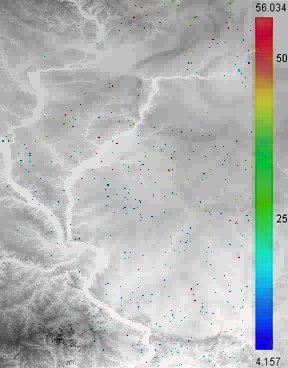
Overlay of the elevation map of Illinois and the Algae predicted values at water station locations.
Algal Biomass Prediction
In our project visualization and data mining tools are applied to Algal biomass prediction in Illinois streams.
The problem of algal biomass prediction in Illinois streams lies in explaining the variability in algal biomass measured as chlorophyl a, based on nutrients (total or dissolved nitrogen, and total or dissolved phosphorus) and other variables (water velocity, canopy cover along the streambank, stream width/depth, etc.). Algae are either the direct or indirect cause of most problems related to nutrient enrichment.
This project was supported by the National Science Foundation and National Center for Supercomputing Applications.
Groundwater Recharge and Discharge Modeling

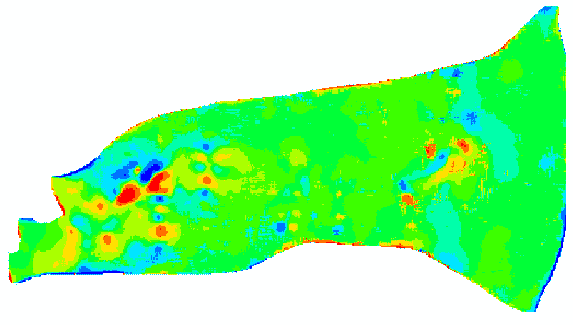
Results of pattern analysis (cell-by-cell recharge estimation) from the recharge/discharge and soil drainage maps of the Buena Vista Basin, Wisconsin.
We focused on the problem of modeling groundwater recharge and discharge rates. The phenomena related to groundwater recharge and discharge result from a set of complex, uncertain processes and are generally difficult to study.
We provide test data to illustrate how to incorporate and mine slope, soil type and proximity to water bodies for predicting groundwater recharge and discharge (R/D) rate models.
The joint research of NCSA and Illinois State Water Survey (ISWS) combines the computer science and ground water science expertise, and leveraged numerical methods and image processing algorithms to efficiently estimate R/D rates. The results of our joint research help hydro-geologists to better understand zonation delineation. The work in progress is being tested against an intensively studied field site in Wisconsin and it will be applied immediately to several groundwater studies in northeastern Illinois.
Spatial Pattern to Learn (Sp2Learn) software presents a framework for accurate estimation of geospatial models from sparse field measurements using image processing and machine learning.
Costa Rica 2050: Web-Enabled Access to Integrated Large Size Airborne Imagery of Costa Rica.

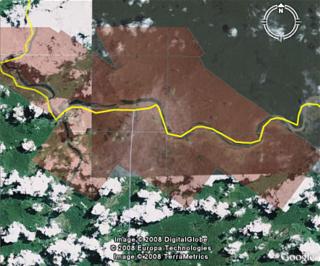
Confluence of the San Juan and San Carlos rivers; surface image with the near-IR map overlayed.
The project of visualization and analysis of the aerial land images of Costa Rica, obtained from the CARTA 2003 and CARTA 2005 missions is part of a broader initiative called the Advanced Research and Technology Collaboratory for the Americas (ARTCA). Activities of researchers from the Instituto Tecnologico de Costa Rica (ITCR), Centro Nacional de Alta Tecnología (CeNAT), National Center for Supercomputing Applications (NCSA) and universities are coordinated by CeNAT in Costa Rica.
Project Overview: (a) Pre-process and integrate large size airborne imagery from three sources for two distinct years 2003 and 2005. (b) Manage the data and enable easy web access for browsing. (c) Prepare a methodology, data workflows and optimal parameters for next CARTA mission.
Environmental Modeling.
The project of visualization of the environmental water quality system. The map and dashboard interfaces show locations of the measuring stations and corresponding data overview. The dashboard allows for viewing of either the extreme (min/max) sampled values or all the sampled values for a chosen location. The visualization is based on both real-time and historical data.


