visualizing data from automated image analysis of historical maps
This is a site dedicated to visualization of results for research conducted in partnership with Robert Markley of the Department of English at the University of Illinois. The project combines studies of 18th Century culture and technology with research in computer vision. We collaborate with Kenton McHenry, Peter Bajcsy, Deepak Neralla, and Tenzing Shaw of the National Center for Supercomputing Applications (NCSA).
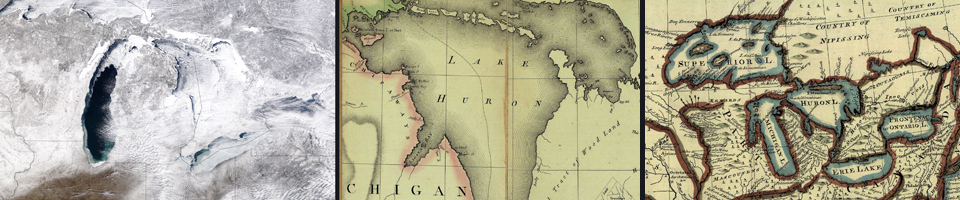
(From Simeone and Markley, manuscript in process): Working with computer scientists under the auspices of a Digging into Data Grant, jointly funded by the NSF, NEH, and JISC, the project used a segmentation algorithm that measures the area in square miles of each of the lakes on forty British and French maps published between the late seventeenth and early nineteenth centuries. Although British and French struggles for political, military, and territorial control over the vast Great Lakes region undoubtedly help to shape individual maps and influence individual mapmakers, we want to entertain the possibility that environmental and specifically climatological considerations play important roles in the mapping of the region over the 150 years we study. More specifically, the wide and often seemingly random distortions in representations of Lake Huron (in particular) over the period likely reflect changing patterns of ice cover and varying water levels. Rather than treating the maps in our study as either primarily aesthetic objects or visualizations of political and economic control (or imperial designs), then, we have worked with computer scientists at NCSA to extract patterns of information that are not readily(if at all) apparent without the image analysis technologies that we have employed.